Characterizing unknown unknowns

Characterizing unknown unknowns

Abstract

Unidentified risks, also known as unknown unknowns, have traditionally been outside the scope of project risk management. Most unknown unknowns are believed to be impossible to find or imagine in advance. But this study reveals that many of them were not truly unidentifiable. This study develops and suggests a model to characterize risks, especially unidentified ones. Through the characterization of unknown unknowns, the model helps identify what had been believed to be unidentifiable or unimaginable risks. Finding more unknown unknowns means converting them to known unknowns so that they become manageable using project risk management. This model is designed to help project managers identify hidden risks, but it is customizable to serve anyone who copes with risks.

Introduction

Disasters like Hurricane Katrina in 2005, the Deepwater Horizon oil spill in 2010, and the Fukushima nuclear accident in 2011 were unanticipated yet extremely damaging. It might seem that such disasters could not have been expected or imagined and therefore not preventable. Indeed, some risks are impossible to detect or even imagine in advance. Checklists or risk breakdown structures of similar projects can help project managers find typical risks but won’t help much for such unprecedented events.

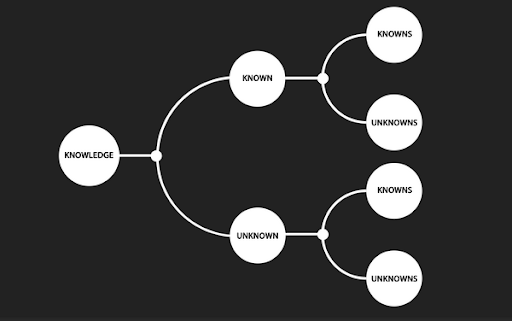
Many people have been trying to understand the nature of hard-to-detect risks or uncertainties. After former U.S. Secretary of Defense Donald Henry Rumsfeld mentioned “unknown unknowns” (Rumsfeld, 2002), people started using quadrants of knowledge, i.e., known known, known unknown, unknown known, and unknown unknown, to understand and explain the nature of risk. Project managers try to maximize known knowns by detecting as many unknown knowns as possible, as early as possible. However, it is impossible to identify all risks in advance for many reasons (Hillson, 2005), and unidentified risks remain as unknown unknowns until they are identified or actually happen.

Much research has explored how to better understand unknown unknowns. The challenges usually reside in the nature of unknown unknowns but, sometimes, problem exists in people rather than the event itself. The major obstacle to addressing unknown unknowns is their being hard to imagine, but another is that people who cannot cope with unknown unknowns will sometimes actively ignore them (Alles, 2009). Although unknown unknowns may be unidentifiable, they might be presumed likely in some component of the project. Diagnosing gaps in the knowledge about certain subproblem areas can predict the presence of unknown unknowns but cannot identify them (Loch, Solt, & Bailey, 2007). A likely event cannot be thought to be unknown unknown because it is already identified, but its consequence may fall into the category of unknown unknowns. The occurrence of an event like a natural disaster may be forecasted easily, but its impact is not easy to predict or estimate because of knock-on effects (Ogaard, 2009).

Despite that project risk management acts as“forward-looking radar,” it is not possible to identify all risks in advance, in part for the following reasons (Hillson, 2005):

Uncertainties may be categorized other than as known unknowns or unknown unknowns. One scheme classifies uncertainty as either subway uncertainty or coconut uncertainty (Makridakis, Hogarth, & Gaba, 2009). Subway uncertainty refers to what can be modeled and reasonably incorporated in probabilistic predictions that assume, for example, normally distributed forecasting errors. Coconut uncertainty pertains to events that cannot be modeled, and also to rare and unique events that are simply hard to envision. To put it simply, subway uncertainty is quantifiable and coconut uncertainty is not. Another way to categorize uncertainties is by whether knowledge and information about them exists but is not accessible, or simply does not exist. The impact of uncertainties of the latter type cannot be evaluated in advance (Stoelsnesa, 2007).

A more detailed way to categorize uncertainties is based on the source of uncertainty (Ward & Chapman, 2003), i.e., variability associated with estimates, uncertainty about the basis of estimates, design and logistics, objectives and priorities, and fundamental relationships between project parties. Each category has subcategories, and this categorization is very project-specific and varies by project.

A typical classification of risks is based on the level of knowledge about a risk event’s occurrence (either known or unknown) and the level of knowledge about its impact (either known or unknown). This leads to four possibilities (Cleden, 2009):


The proposed model modifies and extends these categories to incorporate insights from the literature. This is discussed in the next section, which also explains how to use the model to identify hidden uncertainties and shows how recent catastrophes can be mapped to the model. The final section concludes.


Model to Characterize Unknown Unknowns

Modifying Typical Risk Classification

The development of the model starts with the quadrant model described in the previous section. This classification gives an insightful framework to view various risks but “occurrence” and “impact” doesn’t clearly distinguish identity from occurrence. Suppose there is a very rare but well-known event. People know its identity but don’t know if it will really happen. According to Cleden (2009), this event should be classified as unknown unknown because the occurrence is uncertain and the impact is also uncertain. Suppose there is an event with unintended consequences. “Unintended consequences” is the matter of identification not the matter of uncertainty of occurrence or impact. According to Cleden (2009), this event can be classified as any one of the four possibilities depending on the uncertainty of occurrence and the uncertainty of the magnitude of the identified impact. This classification assumes that every risk event is already identified, but it doesn’t help characterize unidentified risks. In order to distinguish identified risks from unidentified risks, the “level of knowledge about the risk occurrence” should be about being able to identify the risk in advance or not. So, the proposed model labels it “identification.” The “level of knowledge about the impact” should include occurrence as well as impact since either occurrence or impact of a risk can be uncertain. So, the model labels it “certainty.” Exhibit 1 shows a schematic structure of the risk categorization. In this table, the model categorizes events by “identification” and “certainty.”

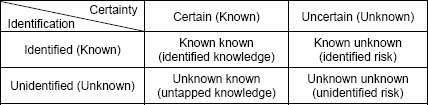
Exhibit 1: Schematic Structure of Modified Risk Categorization

In this matrix, if the nature of an event is certain, it is more like a fact or knowledge. It could be what we already know, i.e., known known, or what we don’t know yet, i.e., unknown known. If the nature of an event is uncertain, the occurrence can be uncertain, i.e., probability of occurrence is less than 1, and the impact can be uncertain as well. For example, a hurricane has two basic uncertainties. One is track, represented by the chance of landfall, and the other one is intensity, represented by wind speed or hurricane category. If either one of occurrence or impact is uncertain, that event is considered to be uncertain. Often times, people know the identity of an uncertain event, which means known unknown. Sometimes, people even don’t know what that is, which means unknown unknown. Most natural disasters are uncertain events but people already know what they are.

In this matrix, known unknowns usually are treated as “risks” in project risk management (PRM) as defined in A Guide to the Project Management Body of Knowledge Guide (PMBOK® Guide) (Project Management Institute, 2008). On the other hand, unknown unknowns are considered to be unfathomable or even unimaginable to many people and PRM does not attempt to account for unknown unknowns.

Once identified, an unknown unknown is converted to a known unknown and moved to the quadrant at the right top in this matrix. Converting unknown unknowns to known unknowns means reducing the number of unidentified uncertainties even though we don’t know how many of them are still remaining unidentified. The more unknown unknowns are identified, the less chance a project will have to be affected by a surprise.

Extensions of the Modified Risk Categories

The study found that all unknown unknowns are not same and significant portion of them are not truly unimaginable. Unknown unknowns in Exhibit 1 can be interpreted as “unidentified uncertain event.” “Uncertain event” is not as simple as it may look. The occurrence of an event can be uncertain as represented by a probability. The impact of the event can also be uncertain as represented by a probability distribution.

“Unidentified” events are not as simple as they may look. The identity of an event can be unidentified but its consequences can also be unidentified, especially when an event has multiple consequences. For example, natural disaster like Hurricane Katrina was an event already identified but many of its consequences were not identified before they really happened. Unidentified consequence is different from estimation error. Estimation error is overestimation or underestimation of the magnitude of a consequence but unidentified consequence is about unintended effects of an event that are different type from identified consequences.

Classifications of the unidentified and the uncertain explained above extends Exhibit 1 as shown in Exhibit 2.

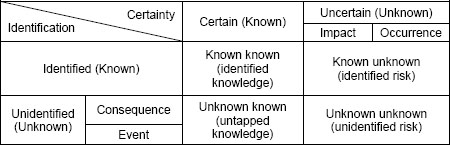
Exhibit 2: Extension of Unknowns

All “unidentified” events are not the same in terms of knowledge gap. Some of them are not identified because there is no access to the knowledge or information even though they are available (Stoelsnesa, 2007). Some of them are unimaginable because the knowledge or information is not available. Some of them have already been detected but are neglected for some reason.

An unidentified risk may be identified under a special circumstance. A person or a group of people may have identified a risk that is not identified by most people. This risk is an unknown unknown to most people, but is a known unknown to that person or group. A risk that is not identified today may have been identified in the past. A risk that is not identified under normal condition may be identified under some condition like political or climatic condition. A risk that is not identified at a project level may be identified at a component level or a higher level.

Risks that are not identified separately may be identified when combined or interacting with each other in forms of new risks or unintended consequences.

To include different categories of “unidentified” described above, the model extends each “unidentified” quadrant in Exhibit 1, i.e. unknown known and unknown unknown, as shown in Exhibit 2. “Unidentified” is classified in two ways: (1) the type of knowledge gap; and (2) how the identification is separated. The model includes three types of knowledge gap. One type labeled “unavailable” means that there is no knowledge or information to access in advance. In this case, the risk is unimaginable. Another type labeled “inaccessible” means that the knowledge or information is available but people have no access to it. The last type labeled “ignored” means that the knowledge or information was already detected but is ignored or neglected for some reason.

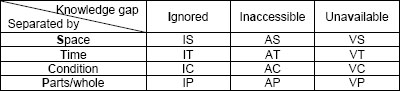
Exhibit 3: Classifying “Unidentified”

The other way to classify “unidentified” is by how the identification is separated. This model adopted separation principles of TRIZ (Savransky, 2000) to classify “unidentified” based on how the identification is separated. There are four basic separation principles and first one of them is separation by space labeled “space” in Exhibit 2. This means that a risk can be identified or not depending on physical space, geographical region, professional discipline, or individual. A knowledge or risk that is not identified in most places may be identified only in a region. A knowledge or risk that is not identified by most people may have been identified by an individual or a group of people. Second, one is separation by time labeled “time” in the table. This means that a risk can be identified or not depending on the timing. An event that is not identified right now may be identified at a specific point of time in a project. Some risks are time-dependent or progress-dependent and can be identified only at some point of time or phase in the project. Third, one is separation by condition labeled “condition” in the table. This means that a risk can be identified or not depending on conditions. The condition can be political condition, environmental condition, physical condition, or previous actions taken. Some risks are response-dependent, i.e., secondary risks, and they are conditioned to a specific response. The last one of them is separation by parts/whole labeled “parts/whole” in the table. This means that a risk can be identified or not depending on the scale. Some risks can be identified only at subsystem level, like components of a system or project. Some other risks can be identified only at super system level, like project, program, or enterprise. Some risks can be identified only in combination or interaction of multiple risks. Items in known knowns and known unknowns quadrants may feed into this category.

In this table, a project can be investigated in 12 different combinations and it means that there are 12 different ways to identify unknown knowns or unknown unknowns. For example, instead of just trying to find any hidden risks in a project, a project manager can seek for hidden risks asking questions like “What can be a risk neglected by people?”, “What can be a risk that happens in a certain condition?”, or “What can be an “inaccessible” risk that happens when interacting with other events?”

After considering all the perspectives described previously, a basic model is shown in Exhibit 4. Unknown unknowns now have 48 subcategories.

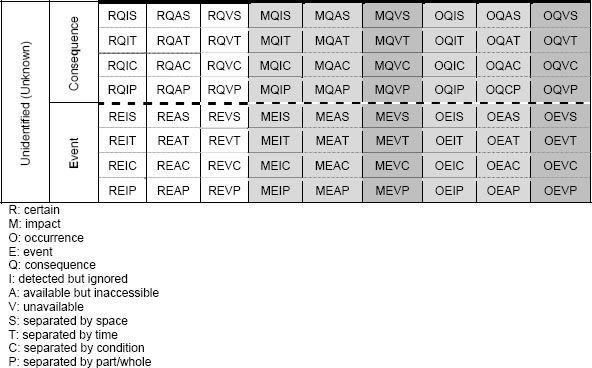
Exhibit 4: Extended Model for Characterizing and Identifying Unknown Unknowns

Shaded areas in the table indicate unknown unknowns. Darker shade areas indicate true unknown unknowns because there is no knowledge available in advance. Roughly speaking, lower cells are harder to identify than higher cells and right cells are more uncertain than left cells. We need to know known knowns and known unknowns to start with. They can be seeds to identify the unidentified. Next, we should check larger categories like impact and occurrence under “uncertain” and event and consequence under “unidentified” for any hidden risks. And then, we should check types of knowledge gap and separation. Finally, we should check each cell.

Converting uncertain events to certain ones would be scientists’ job but converting unidentified risks to identified ones would be project managers’ duty. Identifying as many “unidentified risks” as possible so that they are transferred to known unknown quadrant and only minimal number of “unidentified risks” still remains unidentified is the goal of my model.

Case Studies

Hurricane Katrina in 2005 is the costliest natural disaster and one of the five deadliest hurricanes in the history of the United States (Knabb, Rhome, & Brown, 2005). It was not just one of many hurricanes nor force majeure. In hindsight, it was revealed that this natural disaster had unidentified risks, i.e., unknown unknowns. Category 3 hurricanes combined with the failure of the region’s flood-control system and the problem with the design of the levee structure created unexpectedly high loss.

In the proposed model, the event was not unidentified but the consequence was unidentified. The risk was detected and but neglected. The unexpected consequence from the combined risks was not identified. Both of the occurrence of the hurricane landfall and its impact were uncertain. So, what used to be unknown unknowns about Hurricane Katrina can be mapped to MQIS, MIQP, OQIS, and OQIP in Exhibit 3, none of which is in the shaded area. Of course, they are no longer unknown unknowns since they are identified because of what happened in New Orleans in 2005.

Deepwater Horizon BP Oil Spill in 2010 is the largest accidental marine oil spill in the history of the petroleum industry (Robertson & Krauss, 2010). Some people might think the risk was technical and it happened unexpectedly due to the technical challenges in extreme environment. But, in hindsight, it was revealed that there was “a rush to completion” on the well and the management made poor decisions despite several indications of potential hazard. So, the oil spill was the result of the combination of technical risk and managerial risk. The oil spill risk was not unidentified but possible consequences were not properly identified, partly because of the extreme condition, or the risk was neglected for some reason. Both occurrence and impact magnitude of the oil spill were uncertain. So, what used to be unknown unknowns about Deepwater Horizon BP oil spill can be mapped to MQIS, MQIC, MIQP, OQIS, and OQIP in Exhibit 3. None of them is in the shaded area and it indicates that there was no true unknown unknown even thought this disaster was a big surprise to most people.

Fukushima Daiichi nuclear disaster in 2011 is the largest nuclear disaster since the Chernobyl disaster of 1986 (International Business Times, 2011). The disaster was initiated by the large earthquake with a 9.0 magnitude and the large tsunamis with 30-46 feet high waves (Perrow, 2011). Considering the magnitude of the natural disasters, some people might think the disaster was force majeure and there was nothing they could do about it. But, in hindsight, it was combination of natural disasters, technical risks, plan & communication problems, and cultural issues. The risk was identified but the warnings were ignored. The risk event was identified but the consequences were not properly identified. Both the occurrence and the impact were uncertain. So, what used to be unknown unknowns about Fukushima nuclear disaster can be mapped to MQIS, MQIC, MIQP, OQIS, OQIC, and OQIP in Exhibit 3. Just like previous cases, none of them is in the shaded area and it indicates that there was no true unknown unknown even thought this disaster was a big surprise to most people.

Conclusion

Recent surprises that caused catastrophic losses raised the needs for any method to expect the unexpected and identify them in advance. Finding common and typical risks would be relatively easy with the help from conventional tools but identifying non-typical risks in advance has been believed to be very difficult. Based on insightful findings from literatures and recent catastrophes, a matrix model to help identify the unknown unknowns in advance has been developed. This model does not provide comprehensive list of unknown unknowns but it will contribute to reducing the surprises that could have been identified and prepared before they happen.

This model will help project managers but it is still necessary for them to repeat the use of the model on a regular basis to identify hidden risks because some risks are still not knowable in advance.

This model is designed for project managers dealing with risks but it is general enough to be tailored or extended for various projects or disciplines. The model can have more categories or new dimension when necessary.

Future research will include testing, validating, and enhancing this model in real projects.

References

Alles, M. (2009). Governance in the age of unknown unknowns. International Journal of Disclosure and Governance, 6, 85–88.

Cleden, D. (2009). Managing project uncertainty. Farnham, UK: Gower.

Hillson, D. (2005). Why Risks Turn into Surprises, Risk Doctor Briefings [Electronic Version] No.16. Retrieved from http://www.risk-doctor.com/pdf-briefings/risk-doctor16e.pdf

International Business Times (2011, April). Analysis: A month on, Japan nuclear crisis still scarring. International Business Times [Electronic Version] Published on April 9, 2011. Retrieved from http://www.ibtimes.co.in/articles/132391/20110409/japan-nuclear-crisis-radiation.htm

Knabb, R. D., Rhome, J. R., & Brown, D. P. (2005). Tropical cyclone report: Hurricane Katrina: 23-30 August 2005, National Hurricane Center [Electronic Version] Last updated September 14, 2011 Retrieved from http://www.nhc.noaa.gov/pdf/TCR-AL122005_Katrina.pdf

Loch, C. H., Solt, M. E., & Bailey, E. M. (2007). Diagnosing unforeseeable uncertainty in a new venture. Journal of Product Innovation Management, 25, 28–46.

Makridakis, S., Hogarth, R. M., & Gaba, A. (2009). Forecasting and uncertainty in the economic and business world. International Journal of Forecasting, 25, 794–812.

Ogaard, R. (2009, March). Known unknowns. Reinsurance, p. 9.

Perrow, C. (2011). Fukushima, risk, and probability: Expect the unexpected. Bulletin of the Atomic Scientists [Electronic Version] Retrieved on August 8, 2012 from http://thebulletin.org/web-edition/features/fukushima-risk-and-probability-expect-the-unexpected.

Project Management Institute. (2008). A guide to the project management body of knowledge (PMBOK® guide) (4th ed.). Newtown Square, PA: Project Management Institute.

Robertson, C., & Krauss, C. (2010). Gulf spill is the largest of its kin, scientists say, The New York Times, [Electronic Version] Published August 2, 2010. Retrieved from http://www.nytimes.com/2010/08/03/us/03spill.html?_r=2&fta=y

Rumsfeld, D. (2002). Department of Defense news briefing, February 12, 2002. Retrieved on August 8, 2012 from http://www.defense.gov/Transcripts/Transcript.aspx?TranscriptID=2636

Stoelsnesa, R. R. (2007). Managing unknowns in projects. Risk Management, 9(4), 271–280.

Savransky, S. D. (2000). Engineering of creativity: Introduction to TRIZ methodology of inventive problem solving. Boca Raton, FL: CRC Press.

Ward, S., & Chapman, C. (2003). Transforming project risk management into project uncertainty management. International Journal of Project Management, 21(2), 97–105.

© 2012, Seong Dae Kim
Originally published as a part of 2012 PMI Global Congress Proceedings – Vancouver, British Columbia

Original document,Characterizing unknown unknowns
Source:PMI
Adapted for Academy.Warriorrising

How to Mind Map

How to Mind Map

Mind Mapping is a versatile technique used by over 250 million people worldwide to capture ideas in a way that’s proven to boost productivity, creativity and memory.

Learn how to organize information with this innovative and much-loved visual thinking tool. Mind Mapping is a versatile technique that boosts your productivity by helping you to generate ideas and better analyze them, as well as making it easier to structure and recall information.

Mind Map ideas by hand, or digitally in minutes using software (such as Ayoa). Though both ways are great for sparking creativity, digital Mind Maps have the benefit of being able to be made in just a few minutes and they’re quick and easy to edit.

When creating a Mind Map, there are several elements to consider, such as the map’s central idea, branches, colors, keywords and images.

Let’s take a look at these in our guide below:

How To Create a Mind Map in 5 steps

Step 1: Create a Central Idea

The central idea is the starting point of your Mind Map and represents the topic you are going to explore.

This should be in the center of your page and can include an image or colour that fits with your Mind Map’s topic. This draws attention and triggers associations, as our brains respond better to visual stimuli.

Taking the time to personalize your central idea, whether it’s hand-drawn or made digitally, will strengthen the connection you have with the content in your Mind Map.

Step 2: Add branches to your map

The next step to get your creative juices flowing is to add branches. The main branches which flow from the central image are the key themes. You can explore each of the themes in greater depth by adding child branches.

The beauty of a Mind Map is that you can keep adding new branches and you’re not restricted to just a few options. Remember, the way your Mind Map spans out will come naturally as you add more ideas and your brain freely draws new associations from the different concepts.

Step 3: Add keywords

When you add a branch to your Mind Map, you will need to include a key idea. Try to keep this idea as brief as possible; this will allow you to spark off a greater number of associations, compared to longer more complex phrases.

For example, if you include ‘Summer garden party in July’ on a branch, you are restricted to the aspects of the party you’ve already specified. However, if you split this into a few keywords (e.g. summer’ and ‘garden party’) you can explore more possibilities for each branch by adding a variety of different keywords. Some examples are presents, cake and gazebo.

Limiting words to key phrases on each branch also works well for chunking information into core topics and themes. The use of keywords triggers connections in your brain and allows you to remember a larger quantity of information.

Step 4: Color code your branches

Mind Mapping encourages whole brain thinking as it brings together a wide range of cortical skills from logical and numerical, to creative and special.

The overlap of such skills makes your brain more synergetic and maintains its optimal working level. Keeping these cortical skills isolated from one another does not help brain development, which a Mind Map seeks to do.

One example of whole brain thinking is color coding your Mind Maps. Color coding links the visual with the logical and helps your brain to create mental shortcuts. It allows you to categorize, highlight, analyze information and identify more connections which would not have previously been discovered.

Colors also make images more appealing and engaging compared to plain, monochromatic images.

Step 5: Include visual signifiers (e.g. images)

Don’t forget to add images and other visual elements to your Mind Map as images have the power to convey much more information than a word, sentence or even an essay.

Why is this important? Images are processed instantly by the brain and act as visual stimuli to recall information. They are also a universal language that can overcome any language barrier.

Original document, How to Mind Map
Source: AYOA
Adapted for Academy.Warriorrising

How ‘Mind Mapping’ Can Revamp The Way You Work

How 'Mind Mapping' Can Revamp The Way You Work

The organizational chart known as a “mind map” may remind you of something you drew in elementary school, but it’s actually a powerful productivity tool when used correctly.

The British pop psychologist Tony Buzan coined the term in the ’70s for an organizational technique that is like a web of to-do lists.

You begin with a central topic like “Tasks” (to use a general example) and then branch off into subtopics like “Work, Family, Volunteer Work, and Home” spaced out evenly. Then each of these topics gets their own subtopics, a process repeated as necessary. 

One of the main benefits of using a mind map is that it makes it easier to visualize all of the steps in a project, which helps you see gaps, set goals, and better manage your time throughout the week.

There are plenty of apps and online services you can use to create clean, easily managed mind maps, like XmindMindjet, and MindNodeMindMeister is another great tool, and we’ll take a look at an example made using its software.

Here’s a closeup of its upper-right quarter:

As you can see, it functions as a way to combine your to-do list with your calendar and additional notes in a visual, easy to comprehend way.

Mind maps can be adjusted to scale, outlining an entire project or a single day.

Paul Klipp, president of Lunar Logic’s Polish branch, wrote on Quora that he uses a mind map to arrange his weekly schedule. He spent about an hour making his first one with MindMeister and has since spent 15 minutes every Monday updating it.

He explains how he structures his weekly mind map and how it helps him get things done: “Each top-level node is a project. Outcomes are linked to projects. For each outcome, there are linked tasks to accomplish it. This approach lets me focus on one project at a time, and then on one outcome for that project so that I can discover all the tasks required to arrive at the desired outcome.”

A mind map’s setup also accommodates brainstorming. A project manager can present one to his or her team and have them add branches or adjust details.

Whether you’re using it as a weekly planner or a project outline, a mind map can help you group concepts through associations, come up with new ideas, and stay organized.

Original document, How ‘Mind Mapping’ Can Revamp The Way You Work
Source: Business Insider
Adapted for Academy.Warriorrising

Mind Mapping Techniques

Mind Mapping Techniques

Mind mapping techniques give us an effective way to improve our study and memory skills.

Mind Mapping, one of the best method to capture your thoughts and bring them to life in visual form, is definitely a powerful graphic technique to enhance human performance, which provides a universal key to unleash your brain’s creativity and potential in a uniquely powerful manner.

A mind map can be used in every aspect of life where improve learning and clearer thinking. This guide will cover two types of mind mapping techniques:

Try the best way to make a mind map and check out this tutorial of this powerful mind mapping tool!

Mind Mapping Memory Technique

As many scientists said, you can remember things you have forgotten with the correct trigger. All you need is a good memory technique. A mind map is such a simple memory-improving tool that helps you connect ideas to information you want to remember.

Mind Mapping Study Technique

A mind map includes the full range of cortical skills – word, image, number, logic, color and spatial awareness, which makes it easier to remember your notes.
Using a mind map as study skills can improve:

Original document, Mind Mapping Techniques
Source: edraw
Adapted for Academy.Warriorrising

Mind Mapping Software & Tools

Mind Mapping Software & Tools

Mind Mapping software tools are designed to graphically represent relationships between concepts and ideas. These mind-mapping apps help you analyze, organize, synthesize, recall, and effectively generate new ideas.

We have tested numerous mind mapping tools to check their pros and cons, features, and overall performance. After a detailed review of these tools, we have shortlisted a few of the free and commercial tools with popular features and the latest mind mapping software download links. Please go through our handpicked list of Best Mind Mapping software tools.

EdrawMind is a versatile and user-friendly mind mapping, brainstorming, and outlining tool that enable you to turn your ideas into visuals with the help of timelines, mind map, bubble map, fishbone, Gantt charts, etc. Using this tool, you can conceptualize your own mind maps and switch between different modes to track the overall progress with ease.

It offers over 5000 continually updated template resources and cross-platform support, including Windows, Mac, Linux, Android, and iOS. This mind-mapping software lets you customize every detail and conduct group brainstorming sessions.

Features:

Pros:

Cons

Pricing

There is a free browser version of EdrawMind for users to use online. Alternatively, you can download and install EdrawMind for free on your PC. There is also a 30-day refund option for paid-plan users.

Figma is an online diagram and collaboration application for businesses to create flowcharts, wireframes, sitemaps, mind maps, and mockups. You can easily transform your workflow into detailed components, which allows users to work on the same interface simultaneously in real time.

This free mind-mapping software can work with different versions of the same file and contributes significantly to the UX and UI design process.

Features:

Pros:

Cons

Pricing

The Figma Starter plan is available for free. Additionally, there are paid professional plans that offer a 14-day money-back guarantee.

Miro is a map collaboration tool that allows teams to centralize their cross-functional teamwork. It offers a quick and easy way for a team to capture, manage, and map user stories wireframes, plan scripts, and structure their thoughts.

The tool has an Infinite Virtual whiteboard to complete visual tasks like agile planning, project management, and design iteration. It can integrate over 20 tools, including InVision, Confluence, Slack, Google Drive, Jira, and more.

Features:

Pros:

Cons

Pricing

You can access the Miro basic mind map plan for free. There are also paid plans available with a 14-day risk-free money-back policy.

Lucidchart is an HTML-5-based UML tool that offers real-time collaboration capabilities and can generate simple flowcharts for complex technical diagrams.

Lucidchart runs on a browser having HTML5 and does not require updates of any third-party tools or plugins. This mind mapping app allows you to create diagrams, connect live data with your drawings, or import data to automatically build organization charts.

Features:

Pros:

Cons

Pricing

You get a free version with all the basic visual activities and data linking. Alternatively, there are paid premium plans with a cancel-anytime option available.

Ayoa is a tool for generating the central idea and collaborating with others, allowing individuals and teams to quickly create mind maps.

This mindmap tool enables you to adjust the appearance of your branches and connectors. It also offers a way to organize your map by placing categories around branches.

Features:

Pros:

Cons

Pricing

Ayoa Free Plan makes your work easier by breaking down your thoughts and organizing your ideas. On the other hand, there are also paid plans available for advanced users.

Mindomo is an online concept mapping and outlining app that lets you achieve your goals by visually mapping ideas, plans, and interests.

You can engage the team with collaborative online Gantt charts using this free mind-mapping software solution. Users can use AI’s help to generate mind maps easily and edit the existing ones.

Features:

Pros:

Cons

Mindomo comes with a free version having all the regular features. Also, paid plans are available for advanced users with a 30-day money-back policy.

Mindmup is a mind map software written in JavaScript and can run in HTML5 browsers. You can create and store concept maps and argument maps online using this tool. This mind-mapping software automatically adds contextual information as well as images.

It is one of the best mind-mapping tools to add longer text, spreadsheets, and videos to your mind maps. Mindmup also allows you to save to Google Drive and manage using Google Apps.

Features:

Pros:

Cons

Pricing

You can use the free Mindmup version to access all the basic features. Alternatively, there are also paid plans for advanced users.

Coggle is a browser-based mind map software that produces hierarchically structured documents. This tool contrasts with collaborative applications like Google Docs, which provide a spreadsheet or text document format.

This mind-mapping software enables you to produce beautiful notes quickly and easily. Anyone can change the diagram without any login using this best free mind map software. It is one of the free mind-mapping software which offers real-time collaboration with unlimited number of maps.

Features:

Pros:

Cons

Pricing

Coggle has free plans with unlimited public diagrams and multiple start points along with basic features and functionalities. Alternatively, an advanced set of features comes with the paid versions.

DrakonHub is an online diagramming tool that creates clear flowcharts, checklists, and mind maps. This tool is designed for business users, developers, and managers to create visual business processes.

You can add the boxes, and it will automatically draw the lines. DrakonHub supports tablet and real-time editing and makes it possible to divide the diagram into various logical parts with the Image of an animal, object, tree chart, or person.

Features:

Pros:

Cons

Pricing

Sign in for a free account at DrakonHub and access all the available features. Alternatively, there are also paid plans available.

MindMeister is one of the best mind-mapping tools where users can share, visualize, and present their thoughts using impressive graphical techniques to help users brainstorm ideas, take notes, create project plans, and perform other tasks online.

It is a free mind mapping software with a built-in presentation mode that helps you turn mind maps into dynamic slideshows quickly. MindMeister enables you to share your mind maps with as many people as you want and collaborate with them in real time.

Features:

Pros:

Cons

Pricing

Mindmeister has free plans with unlimited map collaborators, Meister task integration, and templates library access for the users. On the other hand, there are also paid features with additional functionality for advanced users.

Bubbl.us is an online brainstorming application. This browser-based online tool is good for project planning, brainstorming, and collaboration. The tool uses Macromedia Flash, accessed via a browser, to eliminate the need to install software.

It is one of the mind-mapping tools that lets you create a colorful and engaging mind map and then save it as an image. This tool can be used for real time collaboration with team members.

Features:

Pros:

Cons

Pricing

Bubbl has free plans with 3 mind maps creation, image export, and shared mind-maps facility. Alternatively, it offers a free 10-day trial for the Paid plans.

Original document, Mind Mapping Software & Tools
Source: GURU99
Adapted for Academy.Warriorrising

Make Your Enemies Your Allies

Make Your Enemies Your Allies

Summary

Rivalries in the workplace can be destructive to both personal career growth and group success. Many attempts to reverse rivalries fail because of the complex way emotion and reason operate in the building of trust. Using a method called the 3Rs, an effective leader can turn a rival into a collaborator, setting the stage for a healthy work life while driving fresh thinking within an organization. Step 1 of the method is redirection, shifting a rival’s negative emotions away from the adversarial relationship. This creates an opening for Step 2, reciprocity, through which a relationship can be established. Here, the essential principle is to give before you ask—offering a rival something of clear benefit and “priming the pump” for a future return that requires little effort on the rival’s part. Step 3, rationality, sets expectations of the new relationship so that efforts made using the previous steps don’t come off as disingenuous. A rival is encouraged to see collaborative opportunities from a reasoned standpoint. A key advantage of the 3Rs is that the method can work to reverse all kinds of rivalries, including those with subordinates, peers, and superiors.

Many well-intentioned efforts to reverse rivalries fail in large part because of the complex way trust operates in these relationships. Research shows that trust is based on both reason and emotion. If the emotional orientation toward a person is negative—typically because of a perceived threat—then reason will be twisted to align with those negative feelings. This is why feuds can stalemate trust: New facts and arguments, no matter how credible and logical, may be seen as ploys to dupe the other side. This effect is not just psychological; it is physiological. When we experience negative emotions, blood recedes from the thinking part of the brain, the cerebral cortex, and rushes to its oldest and most involuntary part, the “reptilian” stem, crippling the intake of new information.

Most executives who decide they want to reverse a rivalry will, quite understandably, turn to reason, presenting incentives for trustworthy collaboration. But in these situations, the “emotional brain” must be managed before adversaries can understand evidence and be persuaded.

When John Clendenin looked at Tom Gunning at Xerox, he immediately saw grounds for a strong partnership beyond a perfunctory subordinate-superior relationship. Gunning had 20 years’ worth of organizational and technical knowledge, and contacts around the company, but he lacked the leadership skills and vision that Clendenin possessed. Conversely, Clendenin understood management but needed Gunning’s expertise and connections to successfully navigate his new company. Unfortunately, Gunning’s emotions were getting in the way. Clendenin needed to employ the 3Rs.

Redirection

Step 1 is to redirect your rival’s negative emotions so that they are channeled away from you. Clendenin decided to have a one-on-one meeting with Gunning, but not in his office, because that would only remind Gunning of the promotion he’d lost. Instead, he found out where Gunning liked to eat and took him there for lunch. “I was letting him know that I understood his worth,” Clendenin says of this contextual redirection.

He followed this with a plain statement of redirection, telling Gunning that a third entity beyond the control of both men was the root cause of their situation. “I didn’t put you in this position,” Clendenin said. “Xerox put us both in this position.”

Many executives scoff when they first hear this story, believing Clendenin’s actions to be too transparent. But redirection doesn’t have to be hidden. With stage magic, for example, audience members understand that redirection is happening, but that doesn’t lessen their acceptance or spoil the payoff of the technique. Other personal interactions work similarly. For instance, we accept flattery even if we recognize it as such.

Another common redirection tactic is to introduce a discussion of things you and your rival have in common, or casually portray a source of tension—a particular initiative, employee, or event—in a more favorable light. It sounds obvious. But redirection will shift negative emotions away from you and lay the groundwork for Step 2: reciprocity.

Reciprocity

The essential principle here is to give before you ask. Undoing a negative tie begins with giving up something of value rather than asking for a “fair trade.” If you give and then ask for something right away in return, you don’t establish a relationship; you carry out a transaction.

When done correctly, reciprocity is like priming the pump. In the old days, pumps required lots of exertion to produce any water. You had to repeatedly work a lever to eliminate a vacuum in the line before water could flow. But if you poured a small bucket of water into the line first, the vacuum was quickly eliminated, enabling the water to flow with less effort. Reciprocity with a rival works in much the same way.

Reflect carefully on what you should give and, ideally, choose something that requires little effort from the other party to reciprocate. Clendenin moved from redirection to reciprocity at the lunch by promising to support Gunning’s leadership development and future advancement at Xerox. But, recognizing that mere promises of future returns wouldn’t be enough to spark collaboration, he also offered Gunning something concrete: the chance to attend executive-level meetings. This was of immediate value, not a distant, murky benefit. Gunning could gain visibility, credibility, and connections.

The arrangement also ensured reciprocity. Gunning’s presence at the meetings furnished Clendenin with on-hand technical expertise and organizational knowledge while giving him “reputation points” with Gunning’s contacts. Thus, his offer created the purest form of reciprocity; if Gunning attended the meetings, Clendenin would never have to explicitly request a quid pro quo.

Reciprocity involves considering ways that you can immediately fulfill a rival’s need or reduce a pain point. Live up to your end of the bargain first, but figure out a way to ensure a return from your rival without the person’s feeling that pressure. Another example comes from Brian’s colleague Adam Galinsky, who advises leaders in contentious restructurings and business closings to generate goodwill among outgoing employees by offering professional references or placements at other companies as long as the employees continue to meet or exceed expectations until their office closes. The employees see immediate value, and although they don’t consciously pay back the organization, the firm nonetheless benefits by maintaining continuity in its workforce until the scheduled closure.

Similarly, a colleague who helps an adversary complete a project, or a subordinate who stays overtime to finish a task for a difficult boss, not only helps that individual but can reap rewards when other teammates or superiors benefit from that effort, too. Here the judicious giving before asking sets a foundation for reciprocity with third parties, whose buy-in can positively assist in reshaping the adversarial relationship. (See the sidebar “Rivalries Don’t Exist in a Vacuum.”)

Rationality

Step 3, rationality, establishes the expectations of the fledgling relationship you’ve built using the previous steps so that your efforts don’t come off as dishonest or as ineffective pandering. What would have happened if Clendenin had left the lunch without explaining how he wanted to work with Gunning going forward? Gunning might have begun to second-guess his new boss’s intentions and resumed his adversarial stance. If a rival is worried about the other shoe’s dropping, his emotional unease can undermine the trust you’ve built.

To employ rationality, Clendenin told Gunning that he needed him, or someone like him, to reach his goals at Xerox. This made it clear that he saw Gunning as a valuable, but not indispensable, partner. Another, softer approach might have involved Clendenin’s giving Gunning “the right of first refusal” to collaborate with him, making the offer seem special while judiciously indicating that there were others who could step in. Just to be clear, Clendenin was not asking Gunning for a specific favor in exchange for the one he’d granted in Step 2. He was simply saying that he wanted him to become an ally.

Clendenin also reinforced the connection between the three steps by making his offer time-limited, which raised the perception of the value of the deal without changing its content. He told Gunning he needed an answer before they left the restaurant. “I needed to nip this in the bud,” Clendenin recalls. “He knew I didn’t care if we sat in that restaurant until midnight if we had to.”

When rationality follows redirection and reciprocity, it should push your adversary into considering the situation from a reasoned standpoint, fully comprehending the expectations and benefits, and recognizing that he is looking at a valued opportunity that could be lost. Most people are highly motivated to avoid a loss, which complements their desire to gain something. Rationality is like offering medicine after a spoonful of sugar: It ensures that you’re getting the benefit of the shifted negative emotions, and any growing positive ones, which would otherwise diffuse over time. And it avoids the ambiguity that clouds expectations and feedback when flattery and favors come one day, and demands the next.

Of course, Clendenin and Gunning did not walk out of the restaurant as full-blown collaborators. But both accepted that they should give each other the benefit of the doubt. Over the following weeks, this new mind-set allowed them to work as allies, a process that deepened trust and resource-sharing in a self-reinforcing cycle. So a potentially debilitating rivalry was transformed into a healthy working relationship and, in time, a strong partnership. Several years later, when Clendenin moved to another Xerox unit, he nominated Gunning as his replacement—and Gunning excelled in the position. The foundation for that remarkable shift had been established during the span of a single lunch.

Adapting the 3Rs

A key advantage of the 3Rs is that the method can work to reverse all kinds of rivalries, including those with a peer or a superior. Later in Clendenin’s tenure at Xerox, he noticed an inefficiency in the company’s inventory systems. At the time, Xerox was made up of semiautonomous international units that stockpiled excess inventory to avoid shortages. Clendenin proposed that the units instead share their inventories through an intrafirm network that would improve resource use and lower carrying costs for the company as a whole. Although the idea was objectively good for Xerox, it threatened the power of some unit vice presidents, so when Clendenin floated his idea, they shot it down.

A short time later, however, following an unexpected announcement by the CEO that the company needed better asset management, Clendenin found a way to reintroduce his proposal to the VPs. Because he knew they viewed him as an unwelcome challenger—or rival—he used the 3Rs.

His first move was to redirect their negative emotions away from him by planning a lunch for them at the regional office and serving them himself. This showed deference. He also presented himself not as an individual pushing a proposal but as someone who could expedite organizational change, shifting the reference point of his rivals’ tension. “With all of those egos and personalities, I never said, ‘This is my idea,’” Clendenin recalls. “I always said ‘we.’”

Applying the reciprocity principle of give before you ask, he requested nothing from them at the meeting. Instead, he facilitated a discussion about the CEO-led initiative. Inventory management was, unsurprisingly, a problem cited by many of the VPs, and Clendenin’s facilitation brought that to light. He then took on the luster of the person who had illuminated a generic problem, rather than someone who wanted to lessen the VPs’ autonomy.

That allowed him to present the rationality of his original idea. All of a sudden, it looked like an opportunity, rather than a threat, to the formerly antagonistic group. Clendenin indicated that he would be willing to coordinate a new system more cheaply than anyone else in the market could offer, while also noting that he might not have time to do so in the future, which raised the perceived value of his offer. The VPs agreed to execute the plan in stages and put Clendenin in charge. The initiative grew in small but steady steps, eventually saving Xerox millions. Equally important, Clendenin’s embrace by his rivals positioned him as a broker in the company and burnished his reputation as an institution builder.

John Clendenin understood that rivalries help no one; indeed, success often depends on not just neutralizing your foes but turning them into collaborators. By using the 3Rs to build trust in his network, Clendenin made sure everyone in his network thrived—including himself, Gunning, their team, the VPs, and Xerox—forming the basis for long-term ties and shared success. Years later, Clendenin started his own international logistics company. His partner in this new endeavor was his old rival, Tom Gunning, and the lead investors were none other than the unit VPs from Xerox who had once shot down his ideas. The authors’ research was supported by grants from the National Science Foundation (OCI-0838564—VOSS) and the U.S. Army Research Laboratory’s Network Science Collaborative Technology Alliance (W911NF-09-2-0053).

Original document, Make Your Enemies Your Allies
Source: HBR
Adapted for Academy.Warriorrising

Three Quick Ways to Improve Your Strategy-Making

Three Quick Ways to Improve Your Strategy-Making

The standard strategy processes at most companies share three common characteristics: 1) you wait until the annual strategy review to revisit your strategy; 2) you put together a SWOT analysis as input to the start of the strategy process; and 3) you start the strategy process with a long and arduous exercise to wordsmith a mission/vision statement or organizational aspiration.

These activities are, no doubt, reassuring and familiar. They are also almost completely useless. Let’s take a look at each in turn:

The annual strategy cycle

Last time I checked, competitors don’t wait for your annual strategy cycle to attack, customers don’t wait for your annual strategy cycle to shift their preferences, and new technology doesn’t wait for your annual strategy cycle to leapfrog yours.

Strategy can’t wait for bureaucratic, non-market timing. When you make your strategy choices, you need to specify what aspects of the competitive marketplace — consumer preferences, competitor behavior, your own capabilities — have to remain true for the strategy to be a good one. Then, you need to monitor those religiously.

If those facts about the marketplace don’t change, then revisiting strategy is unnecessary and unhelpful. But as soon as any one of them ceases to hold true, the strategy needs to be revisited and revised. Waiting for a pre-ordained time to do that has only benefits your competitors.

The up-front SWOT analysis

Perhaps the single most common way to kick off a strategy process is with a SWOT analysis. However, there is simply no such thing as a generic strength, weakness, opportunity, or threat.

A strength is a strength only in the context of a particular where-to-play and how-to-win (WTP/HTW) choice, as is the case for any weakness, opportunity and threat. So attempting to analyze these features in advance of a potential WTP/HTW choice is a fool’s game. This is why SWOT analyses tend to be long, involved, and costly, but not compelling or valuable. Think of the last time you got a blinding insight on the business in question from an up-front SWOT analysis. I bet one doesn’t come to mind quickly. The up-front SWOT exercise tends to be an inch deep and a mile wide.

The time to do analyses of the sort that typically turn up in SWOT analyses is after you have reverse-engineered a WTP/HTW possibility. That will enable you to direct the analyses with precision at the real barriers to making a strategy choice — the exploration will then be a mile deep and an inch wide.

Writing a vision or mission statement

Typically right after the SWOT exercise, the strategy team turns its attention to producing a vision or mission statement. This often devolves into a long and arduous process during which the team members argue sincerely about specific word choices in order to produce the “perfect” statement.

Unfortunately, you can’t nail down your vision/mission statement (or what I refer to as your Winning Aspiration) without having made your where-to-play/how-to-win (WTP/HTW) choice. Spending time wordsmithing a vision/mission statement before making a WTP/HTW choice is a colossal waste of time.

That doesn’t mean an aspiration is unhelpful. So, take a quick first pass at a statement before diving into WTP/HTW. But don’t spend more than an hour on it — and then keep revisiting it during and after the making of the WTP/HTW, capabilities, and management systems choices.

If your strategy process is anchored in these three activities, you can expect to see a big improvement if you simply put the cart back behind the horse and lead with some decisions about where to play and how to win.

Strategy making is not about unearthing and implementing a causal chain from the first principles of market conditions and existing capabilities towards the one right market position. It’s about making choices and taking gambles to get where you want to be. Make your strategy process reflect that fact.

Original document, Three Quick Ways to Improve Your Strategy-Making
Source: HBR
Adapted for Academy.Warriorrising

Business Basics: Using a SWOT Analysis

Business Basics: Using a SWOT Analysis

Amazon uses its strength in e-commerce and cloud computing to dominate online sales of books and other products; Google identified an opportunity in online advertising and now generates billions of dollars in ad revenue every year; and Apple and Samsung counter the threat from each other’s businesses as they fight a daily battle for global smartphone sales. In each of these businesses a SWOT analysis would have been used to shape the strategy of the organization and to reach an informed decision about what direction the company should take.

Why Is the SWOT Analysis Important?

The SWOT analysis is a vital component of every business course, both at the bachelor’s and MBA levels, that any student or manager needs to know. At its simplest, the SWOT analysis allows the manager to understand the strengths of the organization and match them to the opportunities in the wider business environment. It also helps the manager identify weaknesses that need to be addressed and/or threats to future growth. The SWOT analysis looks at the wider environment in which the organization operates to help a business focus upon priorities and identify a way forward.

But despite the simplicity of the SWOT—whether the business is considering new opportunities or trying to understand the threats to its future growth—it is also one of the most powerful decision-making tools available to the modern manager. There is also a tool called the TOWS matrix, which is just a variant of the SWOT analysis and uses the same components.

What Role Does a SWOT Analysis Play in Developing a Business Strategy?

A SWOT analysis plays an important role in developing a business strategy. First, the organization scans its macro-environment (the broader business environment) comprising the political, economic, social, and technological factors that impact the organization and representing the external factors over which they have little influence. A change of government, for example, might mean the loss of jobs from the cancellation of a defense contract. Second, the organization gathers information from its micro-environment, or the specific context in which the business operates: competitors, customers, suppliers, and other key stakeholders.

How Can Data Be Organized Using SWOT Analysis?

Data resulting from macro- and micro-environmental scanning, can then be analyzed using the SWOT analysis to categorize and then prioritize the organization’s options. Strengths are internal to the organization. They are the internal capabilities of the business and represent the core skills of the organization. For example, with Apple, it is design; with Google, it is online search. Weaknesses are the internal limitations of the organization. Perhaps the organization lacks the IT infrastructure to develop a new app, or the absence of the right expertize prevents the company from expanding overseas. Opportunities are the things in the external environment that the organization can take advantage of, such as a different market for an existing product, or an innovative new business model. Threats are from the external environment, perhaps a competitor moving in on a best-selling product or new legislation that requires a change to the way we do business.

What Does an Organization do with Information from a SWOT Analysis?

Having identified the relevant SWOT elements, the organization will engage in either a “matching” or “converting” strategy to utilize the results of the analysis. A matching strategy is where a business

matches its strengths to a corresponding market opportunity. For example, Amazon realized that its strengths in online retail allowed it to gain a competitive advantage in other products beyond books. Alternatively, a converting strategy allows the business to convert threats into opportunities and weaknesses into strengths. A business that lacks an overseas sales presence, for example, might buy a local company and gain a team of experts in a market that was previously underserved.

How Will a SWOT Analysis Help Me as a Future Manager?

Ultimately, a SWOT analysis remains one of the simplest and most powerful aids among the many strategic business tools available. Successful businesses need to make priorities and make decisions based upon the available data, and that is exactly what the SWOT analysis allows the organization to do. The temptation for students and inexperienced managers is to list as many factors under each heading as they can think of, but to be effective it is important to identify the top three or five factors and then place them in ranked order. It is in identifying the most important opportunity, or the most pressing threat, that makes the SWOT so indispensable.

Top companies develop competitive advantage from understanding the opportunities and threats in the marketplace and from identifying where their strengths and weaknesses are. The ability to develop and analyze a SWOT analysis and make informed decisions based upon the results allows you to develop a strategic perspective that will benefit you in a range of different organizations and help you in whatever career path you choose.

Original document, Business Basics: Using a SWOT Analysis
Source: Excelsior
Adapted for Academy.Warriorrising

The Give and Get of Business-to-Business Partnerships

The Give and Get of Business-to-Business Partnerships

New product launches can be hugely successful, whether introducing new types of power drinks, chewing gum or soaps and moisturizers.

However, the launch of new foods or health and beauty items can be financially risky too—studies show 70 to 80 percent of new products fail.

While retailers often push manufacturers to invest in creating new products as a way for retailers to offer wider selections to customers and stay competitive, it’s the manufacturers who bear the brunt of costs and risks, says David A. Griffith, Iacocca chair and chairman of the Department of Marketing.

“Manufacturers invest in R&D [research and development], consumer research, product development, and then they launch it through their channel partner,” he says. “The real question is, are manufacturers being rewarded for their investments? That is what we wanted to find out.”

Griffith examines reciprocal value sharing in manufacturer-retailer relationships in a new article being published in Marketing Letters. The study, exploring whether retailers are giving manufacturers a greater share of the value created for introducing successful new products, is co-authored by Tereza Dean of Ball State University and Roger J. Calantone of Michigan State University.

The researchers surveyed more than 200 retail managers for food, health and beauty items and requested they consider in their responses a single manufacturer with whom they had been doing business for at least three years.

Respondents’ median retail sales were $10 million, and median number of employees was 300. On average, respondents reflected on manufacturers with whom they had done business for 15 years and who had received 39 percent of retailers’ business in their selected category.

“We found that the retailer does look at its relationship with manufacturers as a long-term partnership, but primarily work to value the manufacturers who are able to introduce successful products. They reciprocate by giving the manufacturer greater margin shares,” Griffith says. “That was one of the big takeaways.”

“Retailers are selective in value sharing. They are strategic about it. While pushing manufacturers for new product is central to their aim, they are truly looking for partners who can continuously innovate successfully.”

The researchers also looked at two strategic decisions often made by manufacturers in connection to the introduction of new products—how innovative the products are, and how frequently they are brought to market.

“One of the things we really wondered is, when a manufacturer introduces something that’s very, very innovative [think, self-driving cars], whether that is going to influence the main relationship and new product success enhancing value sharing,” Griffith says.

If consumers aren’t too familiar with the product, there’s more risk to the retailer that it will sit on shelves. If a retailer can’t move a product, it has to run sales, which reduces their profit margin. So, retailers are cautious about sharing value, even if the manufacturers have been successful in the past, he says.

“We found that the reciprocity effect…is suppressed or dampened because of the increased risk taken up by the retailer when the products are really innovative,” Griffith says.

It also matters how often new products are introduced. According to the study, successful manufacturers who introduce new products frequently are rewarded more by retailers than successful manufacturers who innovate less frequently.

“The argument is based upon the hit rate of successful products being high,” Griffith says. “When a retailer is able to provide a continuous stream of innovative, creative products to its customers, it makes the retailer more exciting and attractive in the marketplace.”

Griffith says it’s critical for manufacturers to know their efforts are being rewarded and that retailers view them as partners, especially when the retailer is putting significant pressure on the manufacturer to innovate. He says the research also suggests that manufacturers would be wise to have a mix of products in their portfolios, especially in product categories such as health and beauty where the margins are high.

“You can have some highly innovative products,” he says, “but our research suggests that you also need some less innovative products within your portfolio. It is the success of a manufacturer’s overall product portfolio that will enable it to develop strong retailer partnerships.”

This story appears as “The Give & Get of Business Partnerships” in the 2018 Lehigh Research Review.

Original document, The Give and Get of Business-to-Business Partnerships
Source: Lehigh University
Adapted for Academy.Warriorrising

Business Partnerships

Business Partnerships

Businesses can gain access to ODU’s intellectual capital, innovative technologies and world-class infrastructure through the Center for Enterprise Innovation.

Professional Development

The University provides a wide variety of current, high-quality continuing education courses in a wide range of disciplines. Explore the many certificates, courses, seminars and workshops that we offer.

Vendors

ODU engages over 30,000 vendors each year, providing the necessary goods and services to ensure successful operations. Learn more about doing business with the University.

Original document,  Business Partnerships
Source: ODU
Adapted for Academy.Warriorrising